The Management’s Discussion and Analysis (“MD&A”) of The University of Alabama’s (the “University” or “UA”) annual financial report presents a discussion and analysis of the financial performance of the University during the fiscal years ended September 30, 2020 and 2019. This discussion has been prepared
by management along with the financial statements and related note disclosures and should be read in conjunction with the financial statements and notes. The financial statements, notes, required supplementary information, and this discussion are the responsibility of management.
History, Mission and Governance
The University, the State of Alabama’s (the “State”) oldest institution of higher education, is the senior comprehensive doctoral-level institution in Alabama and began instructing students in 1831. Established by constitutional provision, with subsequent statutory mandates and authorizations, the University advances the intellectual and social condition of all the people of the State through quality programs of instruction, research and service. The University is a fully accredited institution of higher learning offering bachelor’s, master’s and doctoral degrees in nearly 200 fields of study. Professional programs include law and rural medicine. The University, a beautiful 1,300 acre residential campus located in Tuscaloosa, Alabama, features exceptional facilities and technology. UA emphasizes quality programs of teaching, research and service with scholarship opportunities that offer a global perspective, close to 600 student organizations, leading-edge research initiatives, and an academic community united in its commitment to enhancing quality
of life.
The University is governed by The Board of Trustees of The University of Alabama (the “Board”), a body corporate under Alabama Law. The Board also governs The University of Alabama at Birmingham and The University of Alabama in Huntsville, which, along with the University, make up The University of Alabama System (the “System”). The Board determines policy and approves operating budgets, educational programs, facilities
and capital financings for each university, and sets the separate tuition and fee schedules applicable at each university. Oversight responsibilities of the Alabama Commission on Higher Education (“ACHE”) and annual requests for appropriations from the Alabama legislature are coordinated for each campus by the Chancellor of the System with the approval of the Board.
Overview of Financial Statements
The University’s financial report includes three basic financial statements: the Statement of Net Position; the Statement of Revenues, Expenses, and Changes in Net Position; and the Statement of Cash Flows. The University’s financial statements encompass the University and its blended component unit, The Crimson Tide Foundation (“CTF”). The aggregate financial statements of six affiliated foundations are presented discretely from the University:
-
-
National Alumni Association
-
Law School Foundation
-
Donor Advised Fund
-
Capstone Foundation
-
1831 Foundation
-
Capstone Health Services Foundation
-
The MD&A focuses solely on the University and the Crimson Tide Foundation. Information on discretely presented component units can be found in the component units’ annual financial reports, as well as Note 2 – Component Units. The notes to the financial statements provide additional information that is essential to a full understanding of the financial statements. A summary of new accounting standards and their anticipated effects concludes the notes with brief summations of recently issued statements of the Governmental Accounting Standards Board (“GASB”).
In January 2020, the World Health Organization declared the novel Coronavirus (“COVID-19”) a Public Health Emergency of International Concern. The outbreak of COVID-19 has caused domestic and global disruption in operations for the institutions of higher education and has impacted several areas of the University’s financial statements as further discussed within the MD&A and Note 1.
Statements of Net Position
The statements of net position present the financial position of the University at the end of the fiscal year. These statements reflect the various assets, deferred outflows, liabilities, deferred inflows, and net position of the University as of the fiscal years ended September 30, 2020 and 2019.
From the data presented, readers of the statements of net position have the information to determine the assets available to continue the operations of the University. They may also determine how much the University owes vendors, bondholders, and lending institutions. In addition, the statements of net position outline the net position (assets and deferred outflows minus liabilities and deferred inflows) available to the University.
Net position is divided into three major categories. The first category, net investment in capital assets, provides the University’s equity in property, plant and equipment owned by the University.
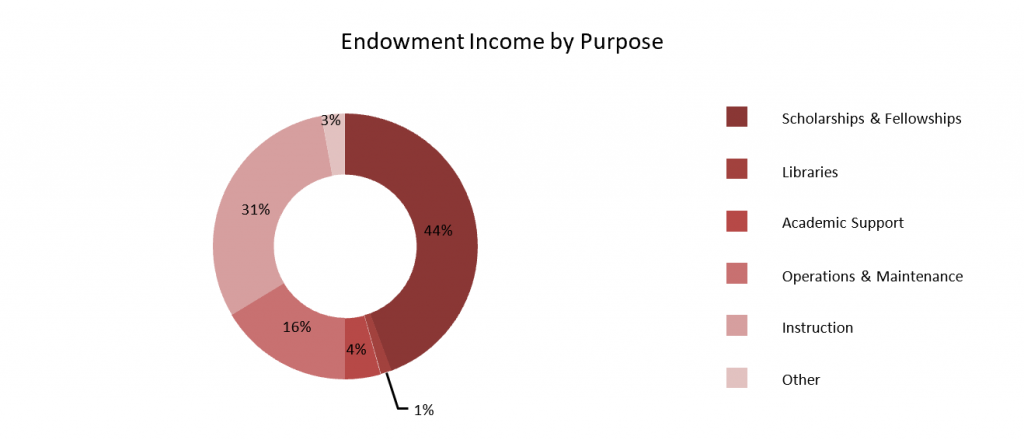
The second category is restricted net position, which is divided into two categories, non-expendable and expendable. The corpus of non- expendable restricted resources, as it pertains to endowments, is only available for investment purposes. The earnings on these funds support the programs and activities as determined by the donors, typically to fund scholarships and fellowships. Expendable restricted resources are available for expenditure by the University but must be spent for purposes as determined by donors and/or external entities that have placed time or purpose restrictions on the use of the assets.
The last category, unrestricted net position, presents the net position available to the University for any lawful purpose of the University and is typically internally designated or committed for specific academic programs or initiatives.
At September 30, 2020, the University’s assets and deferred outflows of resources were $5.0 billion, liabilities and deferred inflows of resources were $2.7 billion, leaving a net position of $2.3 billion. The overall increase in net position of $166.7 million reflects the University’s current year operations including an increase in State educational appropriations and an increase in CTF operating and nonoperating gifts.
A summary of the University’s assets, deferred outflows, liabilities, deferred inflows, and net position follows:
| Condensed Statements of Net Position | |||
9/30/2020 | 9/30/2019 | 9/30/2018 |
|
| Assets | |||
| Current assets | $725,759,658 | $616,255,540 | $553,887,777 |
| Capital assets, net | 2,374,645,592 | 2,172,997,368 | 2,100,055,575 |
| Other noncurrent assets | 1,781,104,859 | 1,967,642,550 | 1,745,944,241 |
| Total assets | 4,881,510,109 | 4,756,895,458 | 4,399,887,593 |
| Deferred outflows of resources | 185,886,393 | 199,303,561 | 175,548,131 |
| Current liabilities | 542,794,538 | 569,959,721 | 534,275,339 |
| Noncurrent liabilities | 1,999,301,337 | 2,134,390,365 | 1,850,454,892 |
| Total liabilities | 2,542,095,875 | 2,704,350,086 | 2,384,730,231 |
| Deferred Inflows of Resources | 201,932,480 | 95,211,670 | 89,599,673 |
| Net Position | |||
| Net investment in capital assets | 1,322,651,902 | 1,210,048,918 | 1,151,792,864 |
| Restricted | 938,919,364 | 898,058,864 | 891,372,760 |
| Unrestricted | 61,796,881 | 48,529,481 | 57,940,196 |
| Total net position | $2,323,368,147 | $2,156,637,263 | $2,101,105,820 |
The University’s Assets
Current assets are used to support the University’s normal operations and are largely composed of cash and cash equivalents, short-term investments available for operating purposes, net accounts receivable (primarily student accounts receivable, receivables from sponsoring agencies and accrued interest receivable), prepaid expenses, and unearned scholarships.
The University considers all highly liquid investments with an original maturity of three months or less to be cash equivalents. Current cash
and cash equivalents totaled $161.4 million at September 30, 2020, an increase of $50.7 million from the prior year. At September 30, 2019, current cash and cash equivalents totaled $110.7 million, an increase of $35.3 million from the prior year. Current cash balances fluctuate based on operating needs, timing of expenditures, and cash management strategies
Short-term investments include both unrestricted and restricted balances. Unrestricted short-term investments were $328.1 million, $269.4 million, and $233.2 million at September 30, 2020, 2019, and 2018, respectively. These investments are available for operating purposes. Restricted short-term investments were $16.8 million,
$13.7 million, and $27.5 million at September 30, 2020, 2019, and 2018, respectively. Restricted short-term investments are comprised of agency fund deposits held and invested by the
University. In fiscal year 2020, total short-term investments increased $61.8 million to support potential disruption in operations caused by the COVID-19 pandemic. Total short-term investments increased in fiscal year 2019 by $22.5 million due to unrealized gains and net investments into the Short Term Liquidity Pool Fund by CTF.
Accounts receivable decreased slightly by $706,000 in fiscal year 2020. In fiscal year 2019, accounts receivable decreased $4.3 million largely due to a decrease in student accounts receivable resulting from the timing of payments around year-end.
Prepaid expenses and unearned scholarships decreased by $7.0 million in 2020 following an increase of $3.7 million in 2019. Prepaid expenses are expected to fluctuate from year to year. Unearned scholarship expense results from the Fall academic term spanning across the fiscal year-end. The University prorates scholarship expense to recognize only the amounts incurred in each fiscal year, which can result in fluctuations depending on the timing of the Fall semester.
Noncurrent assets are predominantly composed of endowment and life income investments, investments for capital activities, other long-term investments, notes receivable (net), and capital assets (net).
The University’s investment portfolio is principally invested in two separate investment pools sponsored by the System. The University’s investment approach is intended to maximize current investment returns consistent with annual liquidity needs while protecting principal. The University adopts the broad objective of investing assets to preserve their real value, enhance the purchasing power of income, and keep pace with inflation and evolving University needs. Total noncurrent investments decreased $229.6 million at September 30, 2020, largely due to unrealized losses and the expenditure of bond proceeds. At September 30, 2019, noncurrent investments increased $198.5 million. During fiscal year 2019, the University issued new bonds which contributed to a $310.5 million increase in investments for capital activities. This was offset by unrealized losses during the fiscal year, as well as the expenditure of bond proceeds.
Noncurrent notes receivable remained stable at $216.5 million in fiscal year 2020. This follows an increase of $13.8 million in fiscal year 2019 due to the issuance of additional student organization housing loans.
Capital assets include land and land improvements, infrastructure, buildings and improvements, equipment, construction in progress, library materials, collections and intangible assets. The construction of new buildings and renovations on campus contributed to a rise in capital assets of $201.6 million in fiscal year 2020 and $72.9 million in 2019. During fiscal year 2015, the University had the opportunity to purchase property within close proximity to the main campus from the Alabama Department of Mental Health (“ADMH”), which allows the University to devote more of its core campus to academic and student life activities. The total purchase, commonly referred to as the Partlow Property, encompasses approximately 362 acres and is composed of both land and associated buildings. As part of the purchase agreement, the University leases back some of the buildings to the ADMH who continues to operate the mental health facilities. The leaseback period is 99 years. Capital spending remains a priority with a shifting focus from new construction to addressing capital renewal and reinvesting in existing facilities and infrastructure to address shifting student demographics and space needs to create world class facilities to support the mission of the institution and scope of its programs and services. As outlined in the University’s Strategic Plan, the University strives to create a beautiful, inclusive and user-friendly campus.
Significant capital asset expenditures in 2020 include BryantDenny Stadium renovations and additions ($91.7 million), Tutwiler Residence Hall ($29.3 million), Math and Science Education Building renovations ($13.8 million), Mal Moore Athletic Facility renovations and additions ($13.3 million), and Hewson Hall ($12.2 million).
Significant capital asset expenditures in 2019 include Student Organization Housing (refer to note 5) ($20.8 million), Capstone Parking Deck ($16.0 million), University Hall renovations ($15.8 million), Aquatic Center renovations ($14.7 million), Paty Residence Hall renovations ($11.8 million), and Bryant-Denny Stadium renovations and additions ($4.1 million).
A deferred outflow of resources is a use of net position that is applicable to future reporting periods. The University’s deferred outflows of resources consist of bond deferred refunding amounts (note 7), pension obligations (note 9), and other post-employment benefits (“OPEB”) obligations (note 10). At September 30, 2020, deferred outflows of resources from debt refundings decreased $1.2 million related to the annual amortization of the refundings. Deferred outflows of resources from pension and OPEB obligations decreased $12.2 million. At September 30, 2019, deferred outflows of resources from debt refundings increased $5.4 million as the University defeased certain indebtedness with the 2019 bond issuance. Deferred outflows of resources from pension and OPEB obligations increased $18.3 million.
The University’s Liabilities
Current liabilities consist of accounts payable, accrued liabilities, unearned revenue, deposits, and the current portion of long-term debt. The majority of accounts payable and accrued liabilities represents amounts owed for salaries, wages and benefits, and supplies and services. Accounts payable and accrued liabilities increased $18.7 million in 2020 largely due to football ticket refunds owed to ticket holders at year-end. As a result of the COVID-19 pandemic, stadium capacity for the 2020-2021 football season was reduced to 20% resulting in refunds that were still being processed at year-end. This follows a decrease of $4.3 million in 2019. Unearned revenue consists primarily of tuition and housing revenues for the portion of the fall semester that occurs after September 30, and football ticket revenue for the portion of the season which occurs after September 30. Current unearned revenue decreased $53.1 million in fiscal year 2020. Fall 2020 out-of-state enrollment is slightly down which impacts unearned tuition revenue. Unearned football ticket revenue decreased due to the reduced football stadium capacity mentioned above. Additionally, CTF unearned revenue decreased $16.8 million due to the recognition of contingent gifts during fiscal year 2020. In fiscal year 2019, there was an increase of $46.3 million in unearned revenues. $41.2 million of the increase is attributable to the Crimson Tide Foundation. During the year ended June 30, 2019, the Foundation reassessed and changed its estimate for the benefit portion of Tide Pride membership dues resulting in more unearned revenues at June 30, 2019 compared to prior years. Deposits increased $8.4 million at September 30, 2020 largely due to reduced expenditures throughout the year, particularly related to the ADMH agency funds. Deposits decreased $16.1 million at September 30, 2019 due to expenditures for the Gulf State Park Project.
The University’s long-term debt, pension liability, and other postemployment benefits (“OPEB”) liability comprise the majority of its noncurrent liabilities. Long-term debt (current and noncurrent combined) decreased $44.7 million in fiscal year 2020 as debt repayments were made throughout the year. This follows an increase of $255.8 million in 2019 due to the 2019A, 2019B and 2019C bond issuances, offset by debt repayments and defeasances. In 2020, the University’s proportionate share of the net pension liability in the Teachers’ Retirement System Plan (the “Plan”) increased by $51.8 million to $646.2 million. This follows a $29.2 million increase in 2019 as the discount rate used to calculate the pension liability decreased from the prior year, contributing to an increase in the overall net position liability. The University’s proportionate share of the net OPEB liability in the Alabama Retired Education Employee’s Health Care Trust (the “Trust”) decreased $158.4 million in fiscal year 2020. The decrease results from a change in the discount rate, as well as adjustments made to the anticipated rates of participation, spouse coverage, and tobacco use to more closely reflect actual experience. In fiscal year 2019 the overall Trust net OPEB liability increased due to a slight decrease in the discount rate used, resulting in a $9.7 million increase in the University’s proportionate share of the liability.
GASB Statements No. 68 and 75 require governmental employers participating in multi-employer cost-sharing pension and healthcare benefit plans to recognize liabilities for their proportionate share of the unfunded liability for plans whose actuarial liabilities exceed the plan’s net assets. As required by Alabama statute, all eligible employees of a qualifying public educational employer must be a member of the Teacher’s Retirement System of Alabama (“TRS”). As a qualifying employer, the University is required to make certain employer contributions on behalf of its employees participating in TRS’s defined benefit pension plan. Additionally, Alabama statutes permitted the University to opt-in to provide its eligible retirees with healthcare benefits through the Public Education Employees’ Health Insurance Plan (“PEEHIP”).
The employer contribution rates for both plans are established annually by TRS and PEEHIP, and adopted by the Alabama Legislature. Both the TRS employer contribution rate and the employer’s PEEHIP cost for retiree coverage are based upon the actuarial valuations performed by TRS and PEEHIP, respectively. Although the liabilities recognized under GASB 68 and 75 meet GASB’s definition of a liability within GASB’s framework for accounting standards, the University does not believe that the associated recorded liabilities constitute legal liability for the University, nor do they open the University to other claims on its resources.
A deferred inflow of resources is the acquisition of net position in future periods. The University’s deferred inflows of resources result from pension obligations (note 9), OPEB obligations (note 10), and the University’s remainder interest in its irrevocable split interest agreements (note 1). At September 30, 2020, deferred inflows of resources from pension and OPEB obligations increased $106.8 million, mostly due to an increase in differences between expected and actual experience related to OPEB obligations. Deferred inflows of resources from the remainder interest in split interest agreements decreased slightly by $66,000. During fiscal year 2019, deferred inflows of resources from pension and OPEB obligations increased $6.1 million, largely resulting from an increase in pension obligations. Deferred inflows of resources from the remainder interest in split interest agreements decreased slightly by $439,000.
The University’s Net Position
Net position represents the residual interest in the University’s assets and deferred outflows of resources after all liabilities and deferred inflows of resources are deducted. The University’s net position increased $166.7 million during fiscal year 2020, reaching $2.3 billion. This increase reflects the University’s current year operations including an increase in State educational appropriations as well as increases in CTF operating and nonoperating gifts. During fiscal year 2019 net position increased $55.5 million, totaling $2.2 billion, which reflects growth in net tuition and fees, net income from residence halls, and an increase in State educational appropriations in that year.
Net investment in capital assets increased $112.6 million in 2020 following an increase of $58.3 million in 2019. Net investment in capital assets consists of capital assets, net of accumulated depreciation, reduced by the outstanding balances of debt attributable to the acquisition, construction or improvement of those assets.
Restricted nonexpendable net position increased approximately $21.5 million due to gifts and earnings on true endowment corpus funds. This net position type encompasses true endowments that are required to be held in perpetuity. In the prior year, restricted nonexpendable net position experienced growth of $21.8 million also due to gifts and earnings on true endowment corpus funds.
Restricted expendable net position increased $19.4 million in 2020. UA’s restricted expendable net position decreased by $25.9 million due to a decrease in true endowment gains, but was offset by an increase of $45.3 million for CTF due to continued fundraising for a current capital campaign. This follows a decrease of $15.1 million in 2019 largely due to a decrease in true endowment gains. This net position category includes restricted gifts, institutional loan funds, sponsored programs, restricted quasi endowments, term endowments, endowment income and unrealized appreciation, and restricted plant funds. Restricted expendable net position is restricted by externally-imposed constraints.
Unrestricted net position increased $13.3 million in fiscal year 2020 largely due to an increase in State educational appropriations as well as a decrease in operating expenses resulting from the suspension of non-essential spending to help alleviate the financial impact of the COVID-19 pandemic. In fiscal year 2019, unrestricted net position decreased $9.4 million. This decrease resulted from an increase in UA’s unrestricted net position of $22.8 million primarily from increases in net tuition and fees and State educational appropriations that was offset by a decrease in CTF’s unrestricted net position of $32.2 million. During the year ended June 30, 2019, CTF deferred revenues increased due to a change in estimate of the benefit portion of Tide Pride membership dues, which resulted in the decrease to their unrestricted net position.
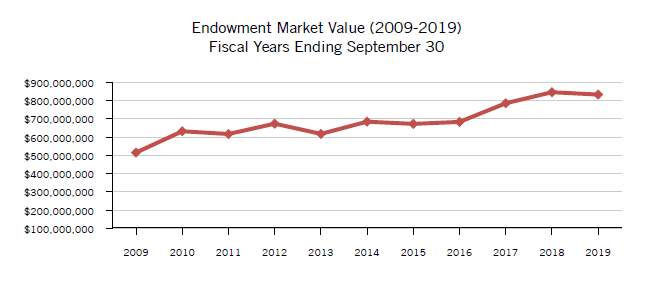
University Endowments
The University carefully navigates the investment environment and works diligently to manage its financial resources effectively. Endowment spending has remained stable. With a continual commitment to excellence, we expect funding given by the University’s generous donors will continue to grow, leveraging those gifts for the benefit of our students for many years to come.
Despite additions to the endowment of $26.9 million and $19.7 million in 2020 and 2019, respectively, the University Endowment declined $12.3 million at September 30, 2020 and $13.1 million at September 30, 2019, primarily due to a decrease in market value as well as a lower appraisal value of the University’s mineral rights in both years. During fiscal year 2019 the University returned all gifts and accumulated earnings received by the University and the Law School Foundation from a donor. Gifts of $20.0 million received by the University were returned to the donor (see note 1).
These endowment totals do not include the endowment values of discretely presented component units.
Statements of Revenues, Expenses and Changes in Net Position
The statements of revenues, expenses and changes in net position (“SRECNP”) present the revenues received by the University, both operating and nonoperating, and the expenses paid by the University, both operating and nonoperating, and any other revenues and expenses recieved or expended by the University. Primary components of the University’s operating revenue sources are tuition and fees and auxiliary sales and services, which are generated from self-supporting departments including Intercollegiate Athletics, residence halls, the UA Supply Store, and food service operations. Additionally, the University seeks funding from the federal and state governments and sponsored programs in support of its mission of teaching, research, and service. Other significant revenue sources, which are considered nonoperating as defined by the GASB, include State educational appropriations, private gifts, investment income, and Federal Pell grants.
Operating expenses are those incurred in conjunction with the fulfillment of the University’s mission and include salaries, wages and benefits; supplies and services; depreciation; and scholarships and fellowships. The SRECNP also includes other changes affecting its net position including capital gifts and grants, additions to permanent endowments, and intragovernmental transfers between the University and CTF, its blended component unit, and other state agencies.
Revenues and expenses are recognized when earned or incurred, regardless of when cash is received or paid. A summary of the University’s revenues, expenses and changes in net position follows:
| Condensed Statements of Revenues, Expenses and Changes in Net Position | |||
9/30/2020 | 9/30/2019 | 9/30/2018 |
|
| Operating revenues | |||
| Tuition and fees, net | $525,521,122 | $532,541,233 | $516,765,773 |
| Auxiliary sales and services, net | 158,930,066 | 201,829,933 | 200,256,134 |
| All other operating revenues | 186,201,714 | 172,464,011 | 158,063,231 |
| Total operating revenues | $870,652,902 | $906,835,177 | $875,085,138 |
| Operating expenses | 1,033,692,957 | 1,108,966,258 | 1,061,866,729 |
| Operating loss | (163,040,055) | (202,131,081) | (186,781,591) |
| Nonoperating revenues (expenses) | |||
| State educational appropriations | 182,797,957 | 169,733,687 | 156,742,802 |
| Gifts | 54,380,178 | 29,440,777 | 48,858,002 |
| Investment income, net | (10,630,633) | 12,791,392 | 90,064,841 |
| All other nonoperating expenses | 6,821,715 | (6,729,665) | (9,530,658) |
| Net nonoperating revenues | $233,369,217 | $205,236,191 | $286,134,987 |
| Income before other changes in net position | 70,329,162 | 3,105,110 | 99,353,396 |
| Other changes in net position | 96,401,722 | 52,426,333 | 89,428,192 |
| Increase in net position | 166,730,884 | 55,531,443 | 188,781,588 |
| Net position, beginning of year, as previously reported | 2,156,637,263 | 2,101,105,820 | 2,135,101,272 |
| Adoption of GASB 75 adjustment (note 1) | - | - | (222,777,040) |
| Net position, beginning of year, as restated, as of October 1, 2017 | 2,156,637,263 | 2,101,105,820 | 1,912,324,232 |
| Net position, end of year | $2,323,368,147 | $2,156,637,263 | $2,101,105,820 |
The University’s net position increased $166.7 million in 2020, primarily resulting from an increase in State educational appropriations as well as an increase in CTF operating and nonoperating gifts. Net position grew by $55.5 million in 2019 due largely to tuition growth, net income from residence halls, and an increase in State educational appropriations. In fiscal year 2018 growth in net tuition and fees and income from residence halls also contributed to an increase of $188.8 million, along with a sharp increase in capital gifts. As noted in the SRECNP, the University experienced operating losses in all fiscal years presented of $163.0 million, $202.1 million, and $186.8 million, respectively. These operating losses highlight the University’s dependency on nonoperating revenues, such as State educational appropriations and private gifts, to meet its cost of operations.
Operating Revenues
Net tuition and fees in 2020 were $525.5 million, a $7.0 million decrease from 2019. Fall 2019 and 2020 out-of-state enrollment decreased slightly which had an impact on fiscal year 2020 tuition revenue. Net tuition and fees in 2019 were $532.5 million, which increased $15.8 million over 2018. Fall 2018 enrollment remained stable and tuition for in-state students did not increase for the 2018-2019 academic year. However, tuition for out-of-state students increased approximately 4.0% which contributed to the net growth. Tuition rates are reviewed annually by the University and presented to the Board for approval.
The University receives grant and contract revenue from federal, state, and local governments and private agencies. These funds are used to further the mission of the University – to advance the intellectual and social condition of the people of the state, the nation and the world through the creation, translation and dissemination of knowledge with an emphasis on quality programs in the areas of teaching, research and service. The following chart reflects the funding sources for federal operating grants and contracts revenue for the years ended September 30:
| Federal Grants and Contracts Revenue | 9/30/2020 | 9/30/2019 | 9/30/2018 |
| Department of Health and Human Services | $13,654,922 | $12,667,692 | $8,199,573 |
| National Science Foundation | 11,638,548 | 10,837,700 | 11,075,042 |
| U.S. Department of Commerce | 4,632,720 | 5,348,457 | 1,330,839 |
| U.S. Department of Education | 5,578,091 | 4,761,363 | 5,125,178 |
| U.S. Department of Energy | 4,406,762 | 4,222,944 | 3,040,526 |
| U.S. Department of Transportation | 4,356,290 | 5,161,137 | 5,258,887 |
| Department of Defense | 6,974,394 | 3,836,233 | 2,940,474 |
| Other Federal Sources | 9,938,770 | 7,661,869 | 7,578,605 |
| Total Federal Contracts and Grants Revenue | $61,180,497 | $41,906,976 | $44,549,124 |
The University has achieved Doctoral Universities – Very High Research Activity status (formerly known as the R1 category) in the Carnegie Classification of Institutions of Higher Education. UA continues to experience record levels of external funding for research and other sponsored activities which impacted expenditures throughout the year, resulting in an increase in federal grants and contracts revenue of $6.7 million in 2020. In fiscal year 2019, federal grants and contracts revenue increased $9.9 million also due to an increase in awards and expenditures.
State and local grants and contracts revenue (combined) increased in 2020 by $237,000, following a slight decrease of $55,000 in 2019. Private grants and contracts revenue decreased by $2.3 million in fiscal year 2020. While expenditures declined in 2020 for privately funded sponsored activities, expenditures are anticipated to rise in the coming years due to increased industry awards. This follows an increase of $1.2 million in 2019 due to an increase in awards and expenditures in that year.
The University’s auxiliary activities are comprised of Intercollegiate Athletics, residence halls, the UA Supply Store, food service operations and other miscellaneous auxiliary enterprises. Auxiliary income decreased $42.9 million in 2020 largely resulting from a decrease in athletics revenue. Due to the COVID-19 pandemic, spring sporting events were cancelled and refunds were issued to ticket holders. Stadium capacity for the Fall 2020 football season was reduced to 20% with no home games played in September which impacted football ticket revenue. Additionally, in March the University transitioned to virtual learning for the remainder of the spring semester due to the rapidly-evolving COVID-19 pandemic, and prorated refunds were issued for dining, housing and parking fees. Auxiliary revenue increased $1.6 million in 2019 due to increases in athletic and licensing revenues, offset by a decrease in revenue from residence halls.
Other operating revenue for UA totaled $22.8 million coupled with CTF revenue of $55.4 million for a combined total of $78.2 million reported in 2020, an increase of $11.4 million from the prior year largely due to an increase in CTF revenues resulting from the prior year change in recording of Tide Pride revenue. Previously, revenue for Tide Pride would have been recorded primarily as gifts. In 2019, other operating revenue increased by $3.7 million also due to an increase in CTF revenues.
Non-Operating Revenues and Expenses
Due to the required classification of key revenue sources such as State educational appropriations, financial aid grants, and private gifts as nonoperating revenues, the University’s operating expenses will typically exceed operating revenues, resulting in an operating loss. These nonoperating revenues are essential in offsetting the operating loss.
In 2020, State educational appropriations increased $13.1 million from the prior year, reaching a total of $182.8 million. In 2019, State educational appropriations increased $13.0 million over 2018 for a total received of $169.7 million. State educational appropriations include supplemental appropriations received from the Advancement and Technology Fund of $8.0 million and $9.1 million in fiscal years 2020 and 2019, respectively.
Gift revenue for the University totaled $54.4 million at September 30, 2020, which was an increase of $24.9 million from the prior year due to an increase in CTF operating gifts as many gift and pledge contingencies were met during their fiscal year 2020. In 2019 gift revenues decreased $19.4 million to $29.4 million due to a decrease in CTF operating gifts. During CTF’s fiscal year 2019, the Foundation reassessed its estimate of the fair value of the benefit portion of all Tide Pride membership dues and determined that all dues received represent a benefit, rather than a portion representing a gift as it had in the past. As a result, 2019 gifts were lower than previous years with a corresponding increase to other operating revenues in fiscal year 2020.
Nonoperating grants consist primarily of Federal Pell grant awards. This program provides financial assistance grants to qualifying undergraduate students to promote access to postsecondary education. Also included in nonoperating grants are Build America Bond and Recovery Zone Economic Development Bond interest reimbursements. In March of 2020, the Coronavirus Aid, Relief and Economic Security (“CARES”) Act was signed into law in order to provide economic assistance for businesses and individuals that have been negatively impacted by the COVID-19 pandemic. During fiscal year 2020, the University received payments primarily from two CARES Act programs, the Higher Education Emergency Relief Fund (“HEERF”) and the Coronavirus Relief Fund (“CRF”). HEERF funds of $20.7 million were received in fiscal year 2020 to be distributed as emergency financial aid grants directly to students, as well as to provide funding for areas of the University negatively impacted by the COVID-19 pandemic. CRF funds of $2.1 million were received during fiscal year 2020 to offset necessary expenses incurred due to the public health emergency with respect to COVID-19. Both of these amounts were recorded in nonoperating grants revenue. As a result, nonoperating grant revenue increased to $51.5 million in 2020. Previously it had remained stable at $32.8 million and $33.2 million in 2019 and 2018, respectively.
Both investment and endowment income are combined as investment income on the SRECNP. Net investment income decreased $23.4 million in fiscal year 2020 and $77.3 million in fiscal year 2019 largely due to lower market values in both years.
Operating Expenses
The University reports natural classifications of expenses in the SRECNP. Salaries, wages and benefits decreased $17.4 million to $711.1 million in 2020 largely due to a decrease in the GASB 75 OPEB expense adjustment. In 2019 salaries, wages and benefits were $728.5 million, which was a $28.7 million increase over $699.8 million in 2018. The University is committed to recruiting and retaining outstanding and diverse faculty, staff and graduate students. Compensation packages and benefit offerings provide leverage for the University to successfully compete with peer institutions and employers outside of the academic sector. The increase in fiscal year 2019 also includes one-time salary activity due to Intercollegiate Athletics coaching changes.
Supplies and services experienced a decrease of $69.9 million during fiscal year 2020. In late March the University suspended all non-essential spending including expenses such as travel, meals, large purchases of equipment, and consulting to help further alleviate the financial impact of the COVID-19 pandemic. This follows an increase of $12.4 million during 2019 due to a rise in contracts and grants expenditures, travel expenses, and a full year of costs related to the Mal Moore Dining Facility which opened at the end of fiscal year 2018.
Scholarships and fellowships expense is reported net of scholarship allowances. The net expenses of $35.4 million, $26.3 million, and $23.7 million for fiscal years 2020, 2019, and 2018, respectively, represent payments made directly to students after awards have been applied against tuition and fees and auxiliary housing charged to student accounts. Gross scholarship expenses, including allowances, totaled $318.9 million, $305.9 million, and $299.6 million for the years ended September 30, 2020, 2019, and 2018, respectively. As mentioned previously, during fiscal year 2020 the University received CARES Act – HEERF funding to assist students negatively impacted by the COVID-19 pandemic. Student aid of $10.4 million is included in scholarships and fellowships expense at September 30, 2020.
| Operating Expenses (by natural classification) | 9/30/2020 | 9/30/2019 | 9/30/2018 |
| Salaries, wages and benefits | $711,111,598 | $728,517,509 | $699,755,982 |
| Supplies and services | 205,449,757 | 275,323,598 | 262,939,882 |
| Depreciation | 81,695,869 | 78,865,931 | 75,485,224 |
| Scholarships and fellowships | 35,435,733 | 26,259,220 | 23,685,641 |
Total operating expenses | $1,033,692,957 | $1,108,966,258 | $1,061,866,729 |
In addition to natural classifications, operating expenses are reported by functional classifications as defined by the National Association of College and University Business Officers (“NACUBO”). The functional classification of an operating expense (Instruction, Research, etc.) is assigned to a department based on the nature of the activity, which represents the material portion of the activity attributable to the department. This method reflects, by function of the University, amounts expended in areas such as instruction, research, and operations and maintenance and is used most commonly for comparative reporting purposes among colleges and universities. Scholarships and fellowships related to auxiliary enterprises are broken out separately below and are comprised primarily of Intercollegiate Athletics and housing scholarships.
| 2020 Operating Expenses (by functional classification) | Salaries,wages and benefits | Supplies and services | Depreciation | Scholarships and fellowships | Total |
| Instruction | $288,748,543 | $32,992,269 | $18,343,614 | - | $340,084,426 |
| Research | 44,343,117 | 27,852,109 | 7,710,179 | - | 79,905,405 |
| Public service | 39,302,941 | 11,862,236 | 1,954,394 | - | 53,119,571 |
| Academic support | 67,338,690 | 7,272,948 | 14,636,575 | - | 89,248,213 |
| Student services | 39,237,571 | 11,781,941 | 5,687,332 | - | 56,706,844 |
| Institutional support | 76,375,465 | 18,852,978 | 8,421,801 | - | 103,650,244 |
| Operations and maintenance | 70,632,805 | 21,100,092 | - | - | 91,732,897 |
| Scholarships and fellowships | - | - | - | 26,788,692 | 26,788,692 |
| Auxiliary enterprises | 85,132,466 | 73,735,184 | 24,941,974 | 8,647,041 | 192,456,665 |
| Total operating expenses | $711,111,598 | $205,449,757 | $81,695,869 | $35,435,733 | $1,033,692,957 |
| 2019 Operating Expenses (by functional classification) | Salaries,wages and benefits | Supplies and services | Depreciation | Scholarships and fellowships | Total |
| Instruction | 297,467,363 | $44,025,924 | $17,316,287 | - | $358,809,574 |
| Research | 38,725,055 | 30,893,292 | 7,285,356 | - | 76,903,703 |
| Public service | 37,948,763 | 12,864,748 | 1,805,580 | - | 52,619,091 |
| Academic support | 67,030,949 | 17,182,958 | 14,185,268 | - | 98,399,175 |
| Student services | 40,900,552 | 16,492,629 | 5,590,605 | - | 62,983,786 |
| Institutional support | 79,689,598 | 19,234,060 | 7,621,508 | - | 106,545,166 |
| Operations and maintenance | 74,106,901 | 27,075,521 | - | - | 101,182,422 |
| Scholarships and fellowships | - | - | - | 15,704,771 | 15,704,771 |
| Auxiliary enterprises | 92,648,328 | 107,554,466 | 25,061,327 | 10,554,449 | 235,818,570 |
| Total operating expenses | $728,517,509 | $275,323,598 | $78,865,931 | $26,259,220 | $235,818,570 |
Other Changes in Net Position
Capital gifts and grants experienced an increase of $41.5 million in fiscal year 2020 primarily due to an increase in CTF capital gifts from continued fundraising for a current capital campaign resulting in new gifts and pledges. Additionally, contingent gifts and pledges previously recorded as unearned revenue in fiscal year 2019 were recognized in fiscal year 2020. In fiscal year 2019 capital gifts and grants decreased $32.0 million following a few large, one-time gifts UA received during 2018.
Additions and other adjustments to permanent endowments increased by $7.1 million in fiscal year 2020. In 2019 additions to permanent endowments decreased by $5.2 million. During fiscal year 2019 the University returned all gifts and accumulated earnings received by the University and the Law School Foundation from a donor. Gifts of $20.0 million received by the University were returned to the donor (see note 1). This reduction was offset by an increase in endowment coal royalties and other endowed gifts.
Intragovernmental transfers are typically transactions between the University and CTF, a blended component unit of the University, and occasionally other state agencies.
At September 30, 2020, intragovernmental transfers had decreased $4.6 million from the prior year. At September 30, 2019 intragovernmental transfers had increased slightly by $122,000 from the prior year.
Capital Assets and Debt Administration
At September 30, 2020, the University had $3.4 billion invested in gross capital assets and accumulated depreciation of $1.0 billion, a net of $2.4 billion. At September 30, 2019, the University had $3.1 billion invested in gross capital assets and accumulated depreciation of $925.7 million, a net of $2.2 billion. At September 30, 2018, the University had $3.0 billion invested in gross capital assets and accumulated depreciation of $853.8 million, a net of $2.1 billion. Depreciation expense for fiscal years 2020, 2019, and 2018 totaled $81.7 million, $78.9 million, and $75.5 million, respectively. Buildings and fixed equipment are responsible for the largest increase for each year presented. The following schedule summarizes the University’s capital assets, net of accumulated depreciation:
| Capital Assets, Net of Accumulated Depreciation | 9/30/2020 | 9/30/2019 | 9/30/2018 |
| Land | $75,713,043 | $81,661,516 | $81,247,943 |
| Land improvements | 55,161,468 | 56,961,206 | 56,369,068 |
| Infrastructure | 79,028,793 | 95,940,216 | 93,297,868 |
| Buildings and fixed equipment | 1,506,097,751 | 1,668,205,159 | 1,574,928,188 |
| Construction in progress | 105,047,275 | 85,078,199 | 110,448,650 |
| Equipment | 74,593,221 | 79,338,476 | 75,443,501 |
| Library materials and collections | 45,388,385 | 42,954,359 | 45,012,792 |
| Intangible assets | 42,566,781 | 62,858,237 | 63,307,565 |
| Total capital assets, net of accumulated depreciation | $1,983,596,717 | $2,172,997,368 | $2,100,055,575 |
Significant capital asset expenditures for fiscal year 2019 included (in millions):
Student Organizations (refer to note 5) $20.8
Capstone Parking Deck $16.0
University Hall renovations $15.8
Aquatic Center renovations $14.7
Paty Residence Hall renovations $11.8
Bryant Denny Stadium renovations and additions $4.1
Significant capital asset expenditures for fiscal year 2018 included (in millions):
Freshman Residential Housing $36.2
Student Organizations (refer to note 5) $28.2
Tutwiler Parking Deck $21.0
H. M. Comer Hall renovation $17.1
Mal Moore Dining Facility $10.7
University Hall Renovation $8.3
Lakeside Dinning renovation $6.4
The University plans to fund ongoing construction projects with reserves, debt proceeds, private gifts, and various federal and state grants.
At September 30, 2020, the University had $1.2 billion of debt outstanding, of which $41.3 million was classified as current. At September 30, 2019, the University had $1.3 billion of debt outstanding, of which $42.5 million was classified as current. The University issued the 2019A, 2019B and 2019C bonds during fiscal year 2019, resulting in an increase in outstanding debt. The University had $1.0 billion of debt outstanding at September 30, 2018, of which $32.7 million was classified as current.
The large majority of debt obligations bears interest at fixed rates ranging from 0.0% to 6.1% and matures at various dates through fiscal year 2049. The University defeased certain indebtedness with the 2019 bond issuance to secure more favorable rates. This is discussed further in note 7.
The University’s outstanding debt obligations at September 30, 2020, 2019, and 2018, exclusive of debt discounts and premiums of $92.7 million, $100.2 million, and $40.1 million, respectively, are summarized below. Further information may also be found in note 7.
| Schedules of Long Term Debt | 9/30/2020 | 9/30/2019 | 9/30/2018 |
| Bonds payable | $1,128,765,000 | $1,165,085,000 | $962,710,000 |
| Notes payable | 27,907,495 | 28,892,344 | 35,514,577 |
| Total long term debt | $1,156,672,495 | $1,193,977,344 | $998,224,577 |
Future Economic Outlook
The University has positioned itself to weather the uncertain times our economy experiences. Prudent management, cost containment, conservative budgeting, and sensible investment strategies help ensure the University can remain dedicated to its mission of teaching, research, and service. We continuously strive to attract the best students, while increasing the intrinsic and marketable value of education offered at The University of Alabama.
A crucial element to the University’s future will continue to be our relationship with the State of Alabama as we work to maintain competitive tuition while providing an outstanding college education for our students. A direct relationship exists between the growth of state support and the University’s ability to control tuition rates. There can be no assurance of future state appropriations. The University expects to be able to absorb any potential decrease of state funds, without a material reduction of its budget, through a combination of increased tuition, steady enrollment and internal reserves. State appropriations are not, and cannot lawfully be, pledged under debt indentures. Major financial strengths of the University include a diverse source of revenues, including state appropriations, tuition and fees (net of scholarship allowances), auxiliary units’ revenue, private support, and federally sponsored grants and contracts.
The University must have campus facilities that are competitive to support the mission of the institution and scope of its programs and services. The University continues to execute its long-term plan to modernize and expand its teaching, research, and student facilities with a balance of new construction and technology. The University strives to create a beautiful, inclusive and user-friendly campus. The continuous improvement of the University’s aesthetic appeal offers visitors, current and prospective students, employees and the surrounding communities an attractive and appealing atmosphere in which to live and work.
The University’s private support is fundamental in meeting budgetary needs. Gifts received are testaments to the high regard in which alumni, corporations, foundations, and other supporters hold the University. The level of private support underscores the continued confidence among donors in the quality of the University’s programs and the importance of its mission. At the same time, economic pressures may also affect the future level of support the University receives from corporate and individual giving. Our component units have also continued their level of support in the face of the current economic environment.
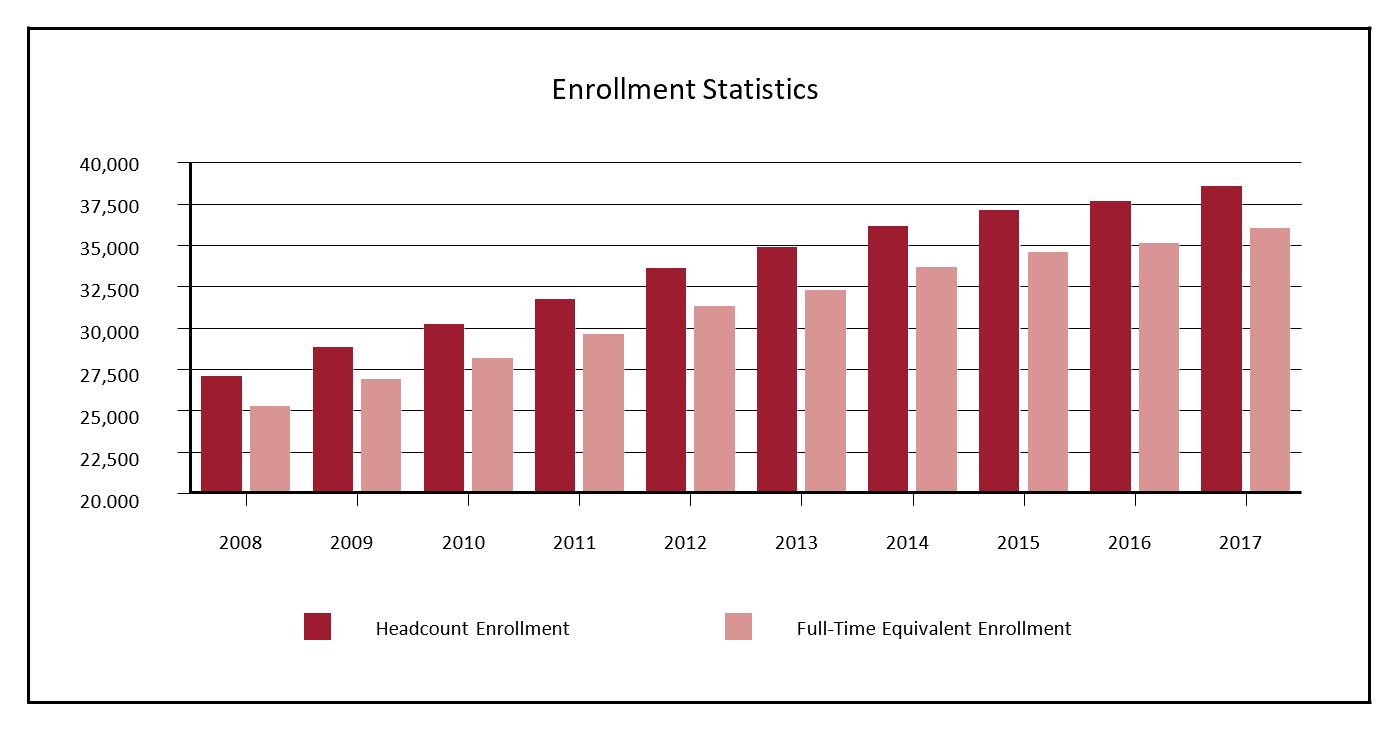
Enrollment and Statistics (Unaudited)*
The University of Alabama is a leader among public universities nationwide in the enrollment of National Merit Scholars with almost 800 currently enrolled. Additionally, approximately 40 percent of the Fall 2020 freshman class scored 30 or higher on the ACT, and 42 percent of the entering class had a high school GPA of 4.0 or higher. University students continue to win prestigious national awards. 57 University of Alabama students have been named Goldwater Scholars. The University of Alabama has produced a total of 15 Rhodes Scholars, 16 Truman Scholars, 36 Hollings Scholars and 15 Boren Scholars. 14 University alumni and students won Fulbright Awards for 2020-2021.
Enrollment at the University remained stable at 38,103 in Fall 2019, a slight decrease of 289 from the prior year. Full-time equivalent (“FTE”) enrollment totaled 35,457, a decrease of 343. The chart below displays enrollment counts taken for each fall semester; the last of which (2019), demonstrates enrollment figures occurring for the fall semester of the 2020 fiscal year.
| Statistical Highlights | ||||||||||
| Fall Headcount Enrollment | 2019 | 2018 | 2017 | 2016 | 2015 | 2014 | 2013 | 2012 | 2011 | 2010 |
| Undergraduate | 32,798 | 33,030 | 33,305 | 32,564 | 31,960 | 30,754 | 29,443 | 28,026 | 26,234 | 24,884 |
| Graduate | 4,870 | 4,916 | 4,787 | 4,629 | 4,649 | 4,870 | 4,851 | 4,994 | 4,913 | 4,726 |
| Professional | 435 | 446 | 471 | 472 | 491 | 531 | 558 | 582 | 600 | 622 |
| Total Fall Enrollment | 38,103 | 38,392 | 38,563 | 37,665 | 37,100 | 36,155 | 34,852 | 33,602 | 31,747 | 30,232 |
| Fall First-Time Freshman Admissions | 2019 | 2018 | 2017 | 2016 | 2015 | 2014 | 2013 | 2012 | 2011 | 2010 |
| Applications | 38,505 | 37,302 | 38,783 | 38,901 | 36,203 | 33,736 | 30,975 | 26,409 | 22,136 | 20,112 |
| Admits | 31,835 | 30,109 | 20,325 | 20,109 | 19,400 | 17,221 | 17,515 | 14,019 | 9,636 | 10,790 |
| Enrolled | 6,764 | 6,663 | 7,407 | 7,559 | 7,211 | 6,856 | 6,478 | 6,397 | 5,772 | 5,519 |
| Percent Admitted | 82.7% | 80,7% | 52.4% | 51.7% | 53.6% | 51.0% | 56.5% | 53.1% | 43.5% | 53.7% |
| Percent Enrolled | 21.2% | 22.1% | 36.4% | 37.6% | 37.2% | 39.8% | 37.0% | 45.6% | 59.9% | 51.2% |
| Degrees Conferred Academic Years Ending May | 19-20 | 18-19 | 17-18 | 16-17 | 15-16 | 14-15 | 13-14 | 12-13 | 11-12 | 10-11 |
| Baccalaureate | 7,429 | 6,912 | 6,749 | 6,501 | 6,354 | 5,662 | 5,408 | 5,000 | 4,482 | 4,463 |
| Master's | 1,831 | 1,750 | 1,681 | 1,578 | 1,651 | 1,672 | 1,645 | 1,659 | 1,571 | 1,513 |
| Juris Doctor | 130 | 134 | 138 | 133 | 144 | 144 | 172 | 168 | 175 | 159 |
| Educational Specialist | 25 | 20 | 22 | 48 | 38 | 48 | 28 | 38 | 53 | 44 |
| Doctoral | 253 | 282 | 290 | 304 | 305 | 379 | 329 | 325 | 252 | 242 |
| Total Degrees Conferred | 9,668 | 9,098 | 8,880 | 8,564 | 8,492 | 7,905 | 7,582 | 7,190 | 6,533 | 6,421 |
| Academic Years Ending May | 19-20 | 18-19 | 17-18 | 16-17 | 15-16 | 14-15 | 13-14 | 12-13 | 11-12 | 10-11 |
| Undergraduate and Graduate Tuition | ||||||||||
| Tuition Per Full-Time In-State Student | $10,780 | $10,780 | $10,780 | $10,470 | $10,170 | $9,826 | $9,450 | $9,200 | $8,600 | $7,900 |
| Percent Increase Over Prior Year | 0.0% | 0.0% | 3.0% | 2.9% | 3.5% | 4.0% | 2.7% | 7.0% | 8.9% | 12.9% |
| Tuition Per Full-Time Out-of-State Student | $30,250 | $29,230 | $28,100 | $26,950 | $25,950 | $24,950 | $23,950 | $22,950 | $21,900 | $20,500 |
| Percent Increase Over Prior Year | 3.5% | 4.0% | 4.3% | 3.9% | 4.0% | 4.2% | 4.4% | 4.8% | 6.8% | 6.8% |
| Law School Tuition | ||||||||||
| Tuition Per Full-Time In-State Student | $23,610 | $23,610 | $23,410 | $22,760 | $22,020 | $21,320 | $20,770 | $19,660 | $18,030 | $15,760 |
| Percent Increase Over Prior Year | 0.0% | 0.9% | 2.9% | 3.4% | 3.3% | 2.6% | 5.6% | 9.0% | 14.4% | 9.1% |
| Tuition Per Full-Time Out-of-State Student | $43,060 | $41,870 | $40,360 | $38,820 | $37,360 | $36,000 | $34,840 | $32,920 | $30,950 | $28,070 |
| Percent Increase Over Prior Year | 2.8% | 3.7% | 4.0% | 3.9% | 3.8% | 3.3% | 5.8% | 6.4% | 10.3% | 5.7% |
*Data provided by the Office of Institutional Research and Assessment